
Press releases
Home sales rebound where supply has surged
May 21, 2026
Southern markets with plenty of choices lead the U.S. in annual sales growth
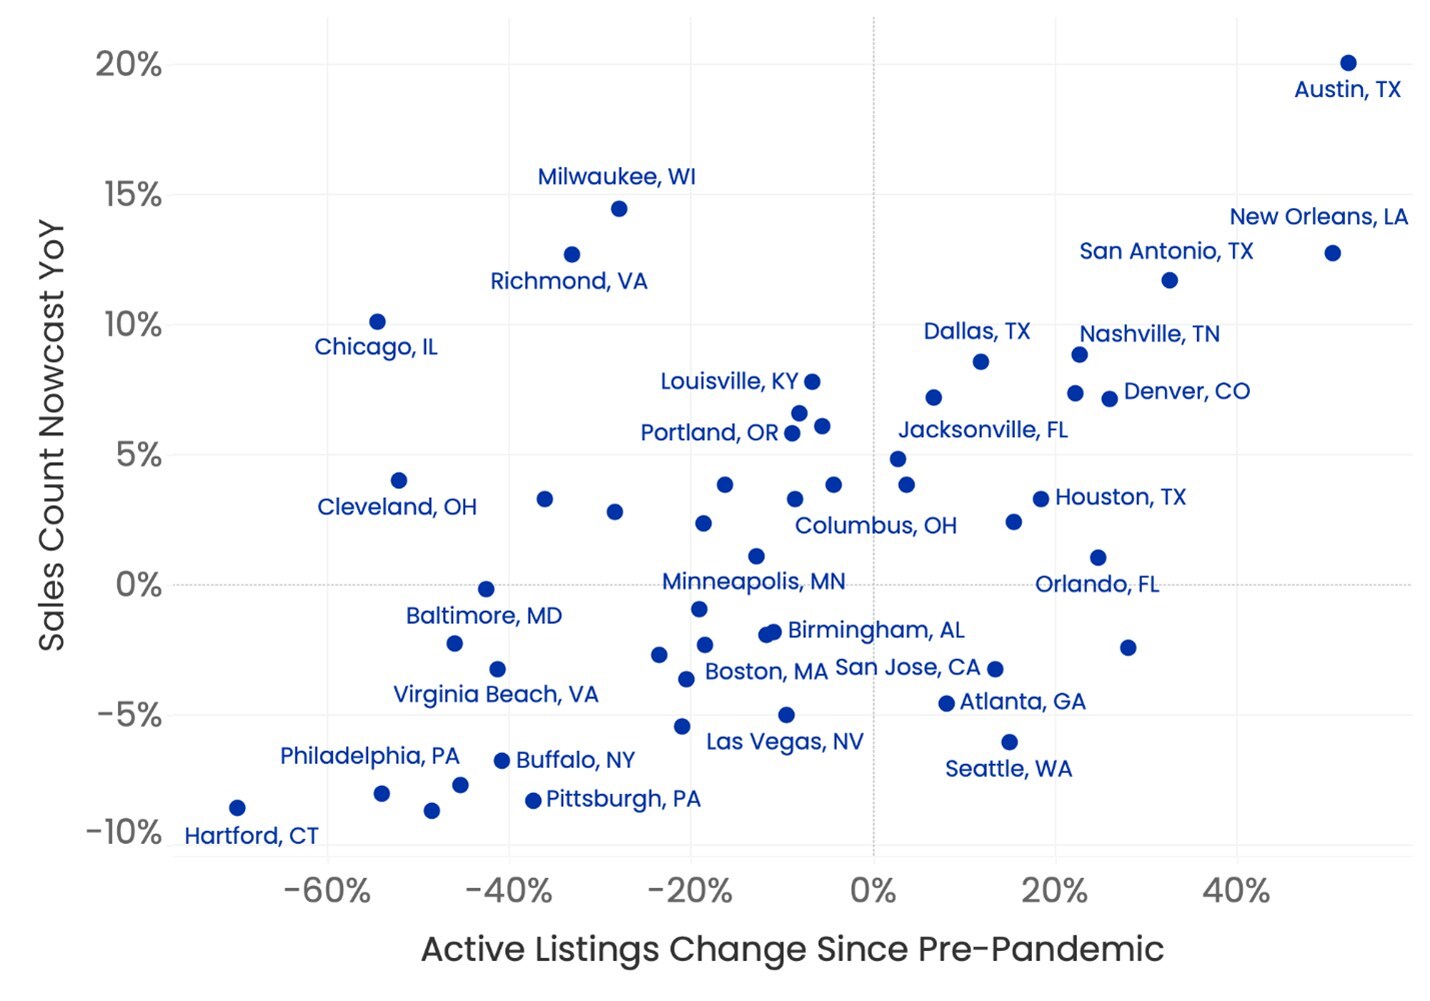
- Home sales rose the most over the year in Austin, according to Zillow, where inventory is a nation-leading 52% above pre-pandemic averages.
- Homes are typically selling after 17 days — roughly in line with pre-pandemic norms.
- Inventory has fully recovered in 19 major metros — concentrated in the South and West — where sales growth is strongest.
SEATTLE, May 21, 2026 /PRNewswire/ -- The spring housing market is warming up fastest in places where buyers finally have options to choose from, according to a new analysis by Zillow®. The trend could help explain why sales still trail pre-pandemic norms, even as individual listings sell at similar speeds.

Austin leads all major metros in both annual sales growth (20%) and inventory added over pre-pandemic norms (52%). Among the top-10 markets for year-over-year sales growth, six have more inventory than before the pandemic.
"After years of low supply, markets with restocked shelves are seeing relatively stronger sales growth," said Zillow Senior Economist Orphe Divounguy. "Construction boomed across the Sun Belt, and we saw activity slow in many markets as they went through a transition period. Those same markets are now coming out the other side as incomes are more in line with prices. Having more homes on the market is helping the market function again."
Buyers' dollars go further in this housing market than they did last year; at the national level a typical monthly mortgage payment is 3.4% lower than April 2025. Sales are slightly higher nationwide, up 2.3% in April compared to last year.
The rising costs of everything else are one limiting factor, straining budgets and pausing major purchases. Inventory is another. There were 3.7% more active listings in April compared to the year prior, but inventory remains 18.7% below historical norms.
In areas that responded to the surge in demand by building additional housing, inventory has recovered faster. Housing inventory now exceeds pre-pandemic norms in 19 of the 50 most populous U.S. metros, with concentrations in the South and West. Now, those metros with the most restored inventory are generally where sales are trending up.
"A lack of supply and stretched consumer budgets are contributing to lower sales volumes," Divounguy said. "The lack of inventory has prevented a larger price correction and limited improvements in affordability. And ultimately, shoppers can't buy what isn't for sale."
Higher inventory tends to put downward pressure on prices. And where income growth has outpaced price growth in recent years, housing affordability has also improved most. Compared to a year ago, the typical monthly mortgage payment has fallen 9.8% in Austin, 7.4% in Dallas, 7% in Denver, 6.2% in Raleigh and 6% in San Antonio. The savings are large when compared to the rest of the country.
Nationwide, the pace of home sales at the listing level is very close to pre-pandemic norms — the median age of inventory is one day less and listings that do go pending typically do so one day faster than in 2018-2019. The big differences are sales totals, inventory and new listings, which are down 18%, 19% and 16%, respectively, in April.
Metro Area* | Existing Home | Existing Home | Inventory | New Listings | Typical Monthly |
United States | -17.7 % | 2.3 % | -18.7 % | -16.3 % | -3.4 % |
New York, NY | -27.3 % | -8.7 % | -48.5 % | -35.5 % | 0.0 % |
Los Angeles, CA | -25.5 % | -1.9 % | -11.7 % | -19.3 % | -4.0 % |
Chicago, IL | -23.4 % | 10.1 % | -54.5 % | -38.3 % | 0.1 % |
Dallas, TX | -10.2 % | 8.6 % | 11.9 % | -7.5 % | -7.4 % |
Houston, TX | -13.4 % | 3.3 % | 18.5 % | -5.6 % | -5.9 % |
Washington, DC | -19.7 % | 2.8 % | -28.4 % | -18.8 % | -4.5 % |
Philadelphia, PA | -24.8 % | -7.7 % | -45.4 % | -24.4 % | -1.5 % |
Miami, FL | -19.7 % | 6.6 % | -8.1 % | -17.7 % | -7.3 % |
Atlanta, GA | -28.8 % | -4.5 % | 8.1 % | -16.0 % | -6.2 % |
Boston, MA | -16.3 % | -2.3 % | -18.6 % | -11.0 % | -2.6 % |
Phoenix, AZ | -28.1 % | 6.1 % | -5.6 % | -14.5 % | -5.7 % |
San Francisco, CA | -14.7 % | 7.2 % | 6.6 % | -10.2 % | -5.4 % |
Riverside, CA | -33.7 % | -3.6 % | -20.6 % | -25.5 % | -5.1 % |
Detroit, MI | -21.5 % | -5.4 % | -21.0 % | -23.1 % | -1.1 % |
Seattle, WA | -31.9 % | -6.1 % | 15.1 % | -4.6 % | -5.8 % |
Minneapolis, MN | -15.2 % | 1.1 % | -12.9 % | -11.8 % | -2.0 % |
San Diego, CA | -27.4 % | -0.9 % | -19.1 % | -22.5 % | -5.4 % |
Tampa, FL | -23.4 % | 2.4 % | 15.6 % | -8.8 % | -7.6 % |
Denver, CO | -14.6 % | 7.2 % | 26.1 % | -8.0 % | -7.0 % |
Baltimore, MD | -13.3 % | -0.2 % | -42.6 % | -25.7 % | -3.2 % |
St. Louis, MO | -17.6 % | -2.3 % | -46.0 % | -23.4 % | -1.3 % |
Orlando, FL | -29.1 % | 1.0 % | 24.8 % | -12.3 % | -7.3 % |
Charlotte, NC | -21.6 % | -2.4 % | 28.0 % | -0.4 % | -4.5 % |
San Antonio, TX | -18.6 % | 11.7 % | 32.7 % | -4.2 % | -6.0 % |
Portland, OR | -22.0 % | 5.8 % | -8.8 % | -17.9 % | -5.1 % |
Sacramento, CA | -28.4 % | 3.9 % | -16.2 % | -20.6 % | -5.8 % |
Pittsburgh, PA | -22.0 % | -8.3 % | -37.4 % | -12.7 % | -3.0 % |
Cincinnati, OH | -19.6 % | -2.7 % | -23.5 % | -8.1 % | -1.5 % |
Austin, TX | -10.2 % | 20.0 % | 52.4 % | -1.4 % | -9.8 % |
Las Vegas, NV | -32.8 % | -5.0 % | -9.5 % | -25.2 % | -6.5 % |
Kansas City, MO | -11.1 % | 3.3 % | -36.1 % | -22.0 % | -0.8 % |
Columbus, OH | -13.8 % | 3.3 % | -8.6 % | -7.6 % | -2.8 % |
Indianapolis, IN | -14.9 % | 3.9 % | 3.6 % | 13.5 % | -2.7 % |
Cleveland, OH | -12.9 % | 4.0 % | -52.3 % | -27.6 % | 0.2 % |
San Jose, CA | -17.0 % | -3.2 % | 13.4 % | -6.5 % | -5.6 % |
Nashville, TN | -2.3 % | 8.8 % | 22.7 % | 14.0 % | -4.8 % |
Virginia Beach, VA | -1.7 % | -3.2 % | -41.2 % | -14.5 % | -1.8 % |
Providence, RI | -37.0 % | -8.0 % | -54.1 % | -30.1 % | -1.1 % |
Jacksonville, FL | -19.5 % | 4.8 % | 2.8 % | -17.7 % | -5.8 % |
Milwaukee, WI | -14.2 % | 14.4 % | -27.9 % | -11.1 % | 1.1 % |
Oklahoma City, OK | -0.9 % | 3.9 % | -4.4 % | -10.5 % | -2.9 % |
Raleigh, NC | -21.5 % | 7.4 % | 22.3 % | 5.6 % | -6.2 % |
Memphis, TN | 17.1 % | 0.4 % | -4.0 % | ||
Richmond, VA | -5.9 % | 12.7 % | -33.2 % | -11.6 % | -2.0 % |
Louisville, KY | -16.4 % | 7.8 % | -6.7 % | 2.4 % | -1.9 % |
New Orleans, LA | 37.6 % | 12.7 % | 50.6 % | 28.1 % | -1.5 % |
Salt Lake City, UT | 10.7 % | -11.5 % | -2.6 % | ||
Hartford, CT | -27.9 % | -8.6 % | -70.0 % | -48.1 % | 0.9 % |
Buffalo, NY | -34.7 % | -6.8 % | -40.8 % | -21.5 % | 0.4 % |
Birmingham, AL | -19.8 % | -1.8 % | -10.9 % | -16.1 % | -2.3 % |
*Ordered by market size | |||||
About Zillow Group:
Zillow Group, Inc. (Nasdaq: Z and ZG) is reimagining real estate to make home a reality for more and more people.
As the most visited real estate app and website in the United States, Zillow connects hundreds of millions of consumers with innovative technology, trusted agents and loan officers, and seamless digital solutions. With industry-leading tools and resources, Zillow supercharges real estate professionals so they can grow their businesses and deliver exceptional client experiences. For renters and housing providers, Zillow offers not only a robust marketplace but a set of end-to-end products and services to streamline applications, leases, payments and more.
Zillow's ecosystem spans the entire home journey — from dreaming and shopping to renting, buying, selling and financing.
Zillow Group's affiliates, subsidiaries and brands include Zillow®, Zillow Premier Agent®, Zillow Home Loans®, Zillow Rentals®, Zillow® New Construction, Trulia®, StreetEasy®, Out East®, HotPads®, Follow Up Boss®, ShowingTime®, dotloop® and Zillow® Closing.
All marks herein are owned by MFTB Holdco, Inc., a Zillow affiliate. Zillow Home Loans, LLC is an Equal Housing Lender, NMLS #10287 (www.nmlsconsumeraccess.org). © 2026 MFTB Holdco, Inc., a Zillow affiliate.
![]()
SOURCE Zillow
For further information: Mark Stayton, Zillow, press@zillow.com