
Press releases
Home buyers need to earn $47,000 more than in 2020
Feb 29, 2024
The income needed to comfortably afford a home is up 80% since 2020, while median income has risen 23% in that time
- Those shopping for homes today need to make more than $106,000 a year to comfortably afford a home.
- A mortgage payment on a typical U.S. home has nearly doubled since 2020.
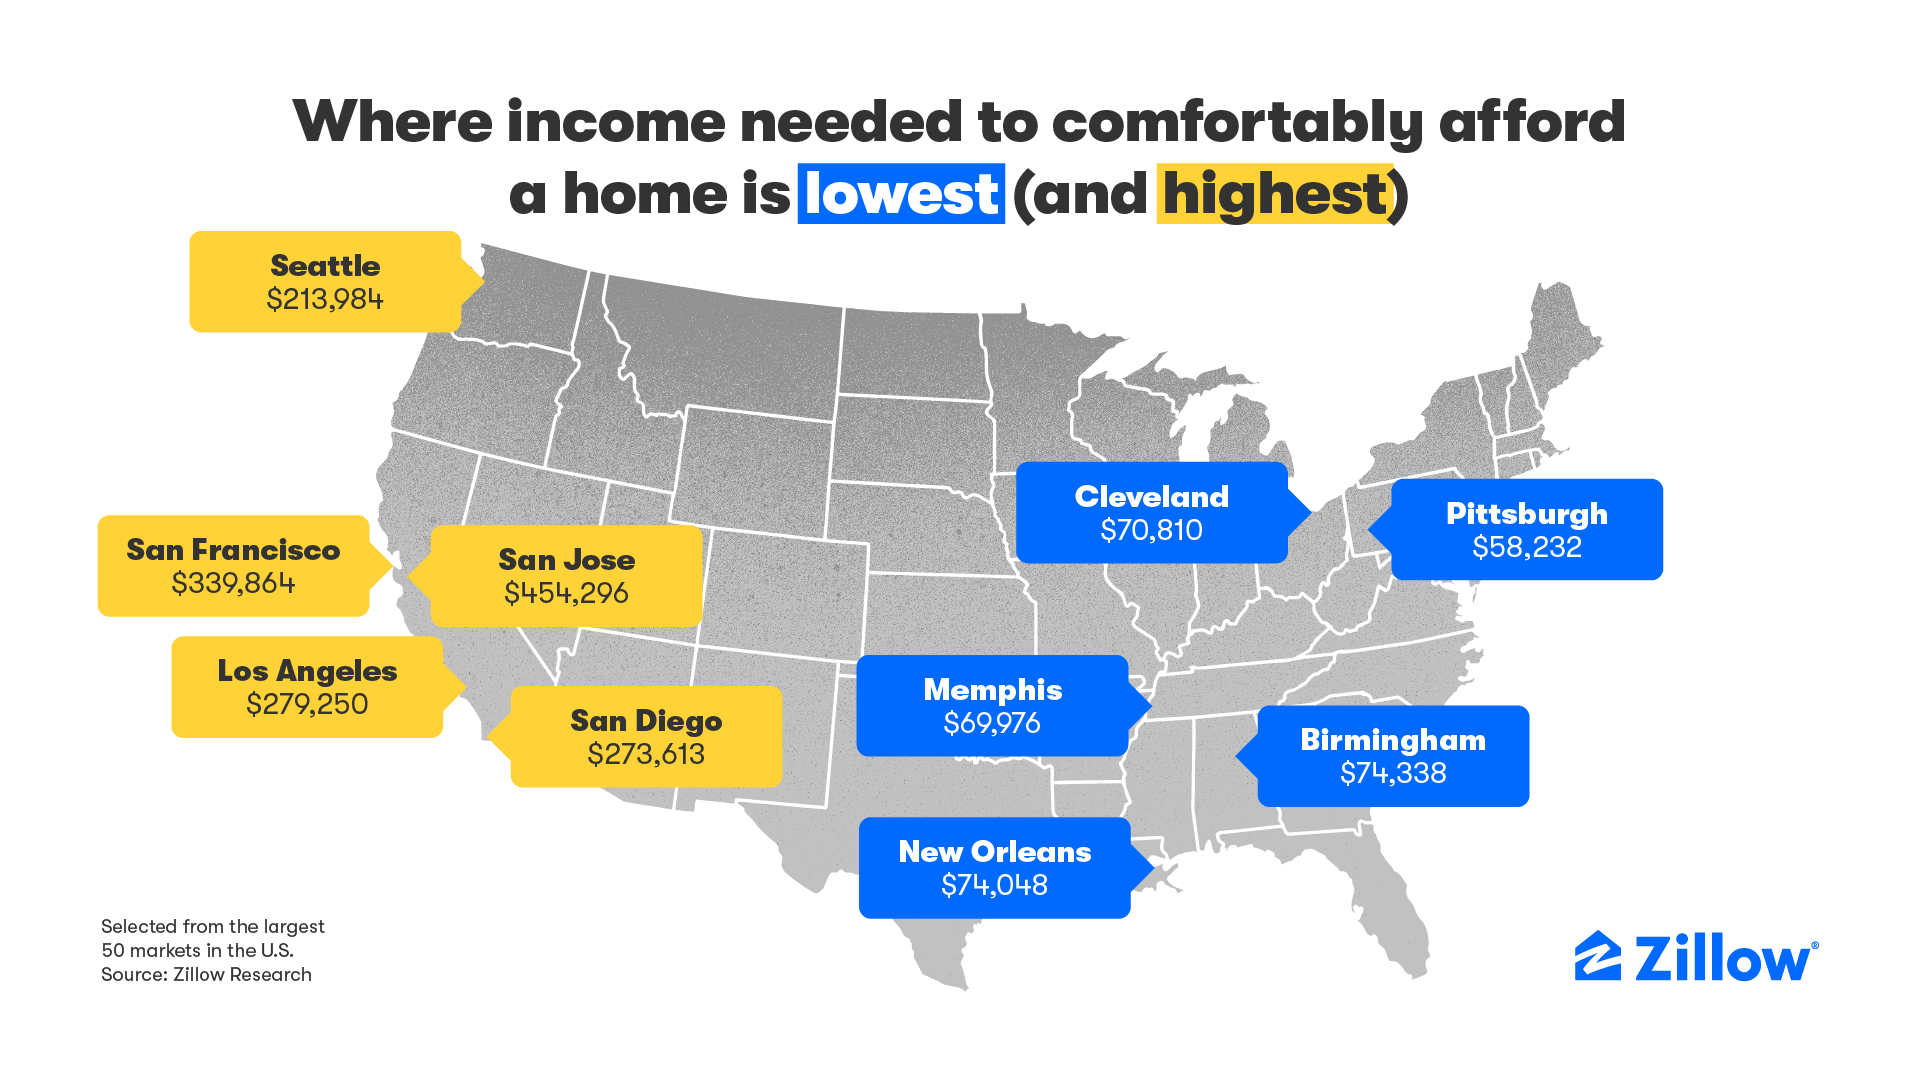
- Pittsburgh, Memphis and Cleveland are the most affordable markets. Households in California need to make the most money to afford a home.
SEATTLE, Feb. 29, 2024 /PRNewswire/ -- Home shoppers today need to make more than $106,000 to comfortably afford a home, a new Zillow® analysis finds. That is 80% more than in January 2020, showing how the math has changed for hopeful buyers, who are more often partnering with friends and family or "house hacking" their way to homeownership.
")
In 2020, a household earning $59,000 annually could comfortably afford the monthly mortgage on a typical U.S. home, spending no more than 30% of its income with a 10% down payment. That was below the U.S. median income of about $66,000, meaning more than half of American households had the financial means to afford homeownership.
Now, the roughly $106,500 needed to comfortably afford a typical home is well above what a typical U.S. household earns each year, estimated at about $81,000.1
"Housing costs have soared over the past four years as drastic hikes in home prices, mortgage rates and rent growth far outpaced wage gains," said Orphe Divounguy, a senior economist at Zillow. "Buyers are getting creative to make a purchase pencil out, and long-distance movers are targeting less expensive and less competitive metros. Mortgage rates easing down has helped some, but the key to improving affordability long term is to build more homes."
A monthly mortgage payment on a typical U.S. home has nearly doubled since January 2020, up 96.4% to $2,188 (assuming a 10% down payment). Home values have risen 42.4% in that time, with the typical U.S. home now worth about $343,000. Mortgage rates ended January 2020 near 3.5%, keeping the cost of a home affordable for most households that could manage the down payment. At the time of this analysis, mortgage rates were about 6.6%.
For a household making the median income, it would take almost 8.5 years before they would have enough saved to put 10% down on a typical U.S. home, about a year longer than it would have in 2020.2 It's no wonder, then, that half of first-time buyers say at least part of their down payment came from a gift or loan from family or friends.
With the cost of a mortgage rising, most millennial and Gen Z buyers say "house hacking" — the ability to rent out all or part of a home for extra cash — is very or extremely important. Co-buying with a friend or relative is another way to help with affordability, something 21% of last year's buyers reported doing.
Metro areas where a buyer could comfortably afford a typical home with the lowest income are Pittsburgh ($58,232 income needed to afford a home), Memphis ($69,976), Cleveland ($70,810), New Orleans ($74,048) and Birmingham ($74,338). The only major metros where a typical home is affordable to a household making the median income are Pittsburgh, St. Louis and Detroit.
There are seven markets among the major metros where a household's income must be $200,000 or more to comfortably afford a typical home. The top four are in California: San Jose ($454,296), San Francisco ($339,864), Los Angeles ($279,250) and San Diego ($273,613). Seattle ($213,984), the New York City metro area ($213,615) and Boston ($205,253) complete the list.
To help find a home within budget, home shoppers on Zillow can filter search results by monthly cost instead of by list price. The tool simplifies the complex calculation of translating a home's list price into the monthly cost, factoring in the latest mortgage rates.
Those needing a down payment boost may qualify for down payment assistance. Home listings on Zillow include a down payment assistance module to help shoppers see what local resources could be available to them.
|
Metropolitan |
Size |
Income Needed |
Change in |
Zillow Home |
Monthly |
Years to |
|
Pittsburgh, PA |
27 |
$58,232 |
$23,675 |
$201,487 |
$1,286 |
5.3 |
|
Memphis, TN |
43 |
$69,976 |
$31,717 |
$230,807 |
$1,473 |
6.9 |
|
Cleveland, OH |
34 |
$70,810 |
$30,227 |
$211,712 |
$1,351 |
6.0 |
|
New Orleans, LA |
46 |
$74,048 |
$19,203 |
$232,870 |
$1,486 |
7.0 |
|
Birmingham, AL |
50 |
$74,338 |
$31,875 |
$246,805 |
$1,575 |
6.7 |
|
Oklahoma City, OK |
41 |
$74,732 |
$31,057 |
$226,048 |
$1,442 |
6.3 |
|
Detroit, MI |
14 |
$75,662 |
$31,124 |
$236,025 |
$1,506 |
6.1 |
|
Buffalo, NY |
49 |
$76,884 |
$34,744 |
$242,435 |
$1,547 |
6.5 |
|
St. Louis, MO |
21 |
$76,895 |
$31,880 |
$238,231 |
$1,520 |
5.9 |
|
Louisville, KY |
45 |
$77,450 |
$31,185 |
$243,810 |
$1,556 |
6.8 |
|
Indianapolis, IN |
33 |
$82,037 |
$38,150 |
$267,301 |
$1,706 |
6.6 |
|
Cincinnati, OH |
28 |
$86,027 |
$38,050 |
$267,423 |
$1,706 |
6.8 |
|
Kansas City, MO |
31 |
$92,896 |
$40,742 |
$289,290 |
$1,846 |
7.2 |
|
Houston, TX |
5 |
$95,374 |
$39,779 |
$300,955 |
$1,920 |
7.5 |
|
San Antonio, TX |
24 |
$95,767 |
$38,307 |
$283,161 |
$1,807 |
7.5 |
|
Columbus, OH |
32 |
$95,821 |
$43,405 |
$297,637 |
$1,899 |
7.3 |
|
Milwaukee, WI |
40 |
$100,822 |
$42,613 |
$321,037 |
$2,049 |
8.5 |
|
Virginia Beach, VA |
37 |
$102,703 |
$43,989 |
$332,820 |
$2,124 |
8.2 |
|
Chicago, IL |
3 |
$104,757 |
$39,716 |
$300,906 |
$1,920 |
6.7 |
|
Richmond, VA |
44 |
$106,170 |
$47,930 |
$349,558 |
$2,231 |
7.9 |
|
United States |
0 |
$106,536 |
$47,490 |
$342,941 |
$2,188 |
8.4 |
|
Philadelphia, PA |
7 |
$109,257 |
$47,837 |
$343,102 |
$2,189 |
7.5 |
|
Jacksonville, FL |
39 |
$109,271 |
$51,617 |
$348,665 |
$2,225 |
8.2 |
|
Charlotte, NC |
23 |
$111,051 |
$55,239 |
$368,712 |
$2,353 |
9.2 |
|
Hartford, CT |
48 |
$114,109 |
$52,114 |
$334,712 |
$2,136 |
7.3 |
|
Minneapolis, MN |
16 |
$114,344 |
$41,867 |
$355,511 |
$2,269 |
7.3 |
|
Baltimore, MD |
20 |
$114,348 |
$44,063 |
$367,861 |
$2,347 |
7.6 |
|
Atlanta, GA |
9 |
$115,430 |
$55,989 |
$370,548 |
$2,364 |
8.0 |
|
Tampa, FL |
18 |
$116,329 |
$58,577 |
$370,474 |
$2,364 |
9.8 |
|
Las Vegas, NV |
30 |
$119,529 |
$54,172 |
$407,516 |
$2,600 |
10.6 |
|
Dallas, TX |
4 |
$121,398 |
$53,679 |
$366,690 |
$2,340 |
8.3 |
|
Orlando, FL |
22 |
$121,418 |
$58,140 |
$386,687 |
$2,467 |
9.9 |
|
Nashville, TN |
36 |
$128,535 |
$59,508 |
$425,827 |
$2,717 |
10.1 |
|
Raleigh, NC |
42 |
$130,472 |
$62,410 |
$430,562 |
$2,747 |
8.7 |
|
Phoenix, AZ |
11 |
$131,322 |
$65,017 |
$447,074 |
$2,853 |
9.9 |
|
Providence, RI |
38 |
$142,928 |
$65,387 |
$449,025 |
$2,865 |
10.1 |
|
Austin, TX |
29 |
$149,267 |
$65,144 |
$451,322 |
$2,880 |
8.8 |
|
Miami, FL |
8 |
$151,163 |
$74,834 |
$472,970 |
$3,018 |
12.3 |
|
Salt Lake City, UT |
47 |
$154,455 |
$72,592 |
$523,832 |
$3,343 |
10.6 |
|
Portland, OR |
25 |
$161,624 |
$65,664 |
$528,724 |
$3,374 |
11.0 |
|
Washington, DC |
6 |
$166,551 |
$64,078 |
$539,116 |
$3,440 |
8.2 |
|
Sacramento, CA |
26 |
$172,261 |
$69,908 |
$559,243 |
$3,569 |
11.6 |
|
Denver, CO |
19 |
$172,704 |
$71,338 |
$566,692 |
$3,616 |
10.7 |
|
Riverside, CA |
13 |
$173,375 |
$81,676 |
$563,468 |
$3,595 |
12.6 |
|
Boston, MA |
10 |
$205,253 |
$86,967 |
$650,890 |
$4,153 |
11.6 |
|
New York, NY |
1 |
$213,615 |
$78,696 |
$627,944 |
$4,007 |
12.9 |
|
Seattle, WA |
15 |
$213,984 |
$94,163 |
$697,824 |
$4,453 |
12.2 |
|
San Diego, CA |
17 |
$273,613 |
$131,018 |
$902,199 |
$5,757 |
16.9 |
|
Los Angeles, CA |
2 |
$279,250 |
$121,457 |
$918,247 |
$5,859 |
19.4 |
|
San Francisco, CA |
12 |
$339,864 |
$119,614 |
$1,104,853 |
$7,050 |
16.0 |
|
San Jose, CA |
35 |
$454,296 |
$191,071 |
$1,493,255 |
$9,528 |
18.8 |
*Table ordered by income needed to afford a mortgage in January 2024.
About Zillow Group
Zillow Group, Inc. (NASDAQ: Z and ZG) is reimagining real estate to make home a reality for more and more people. As the most visited real estate website in the United States, Zillow and its affiliates help people find and get the home they want by connecting them with digital solutions, dedicated partners and agents, and easier buying, selling, financing and renting experiences.
Zillow Group's affiliates, subsidiaries and brands include Zillow®, Zillow Premier Agent®, Zillow Home Loans℠, Trulia®, Out East®, StreetEasy®, HotPads®, ShowingTime+℠, Spruce® and Follow Up Boss®.
All marks herein are owned by MFTB Holdco, Inc., a Zillow affiliate. Zillow Home Loans, LLC is an Equal Housing Lender, NMLS #10287 (www.nmlsconsumeraccess.org). © 2023 MFTB Holdco, Inc., a Zillow affiliate.
1 Median household income is taken from the American Community Survey (ACS) through 2022. Present-day estimates combine changes in the Employment Cost Index provided by the Bureau of Labor Statistics to forecast current median household income.
2 Years to save figures assume a household saves 5% of its total income each month.
3 Smoothed and seasonally adjusted ZHVI.
4 Monthly mortgage payment includes principal and interest as well as estimated taxes and insurance for a 10% down payment on a home priced at that region's ZHVI.
SOURCE Zillow
 |
For further information: Mark Stayton, Zillow, press@zillow.com