
Press releases
Home builders are still playing catchup during construction boom
A limited supply of for-sale homes is a key reason home prices have risen quickly during the COVID-19 pandemic
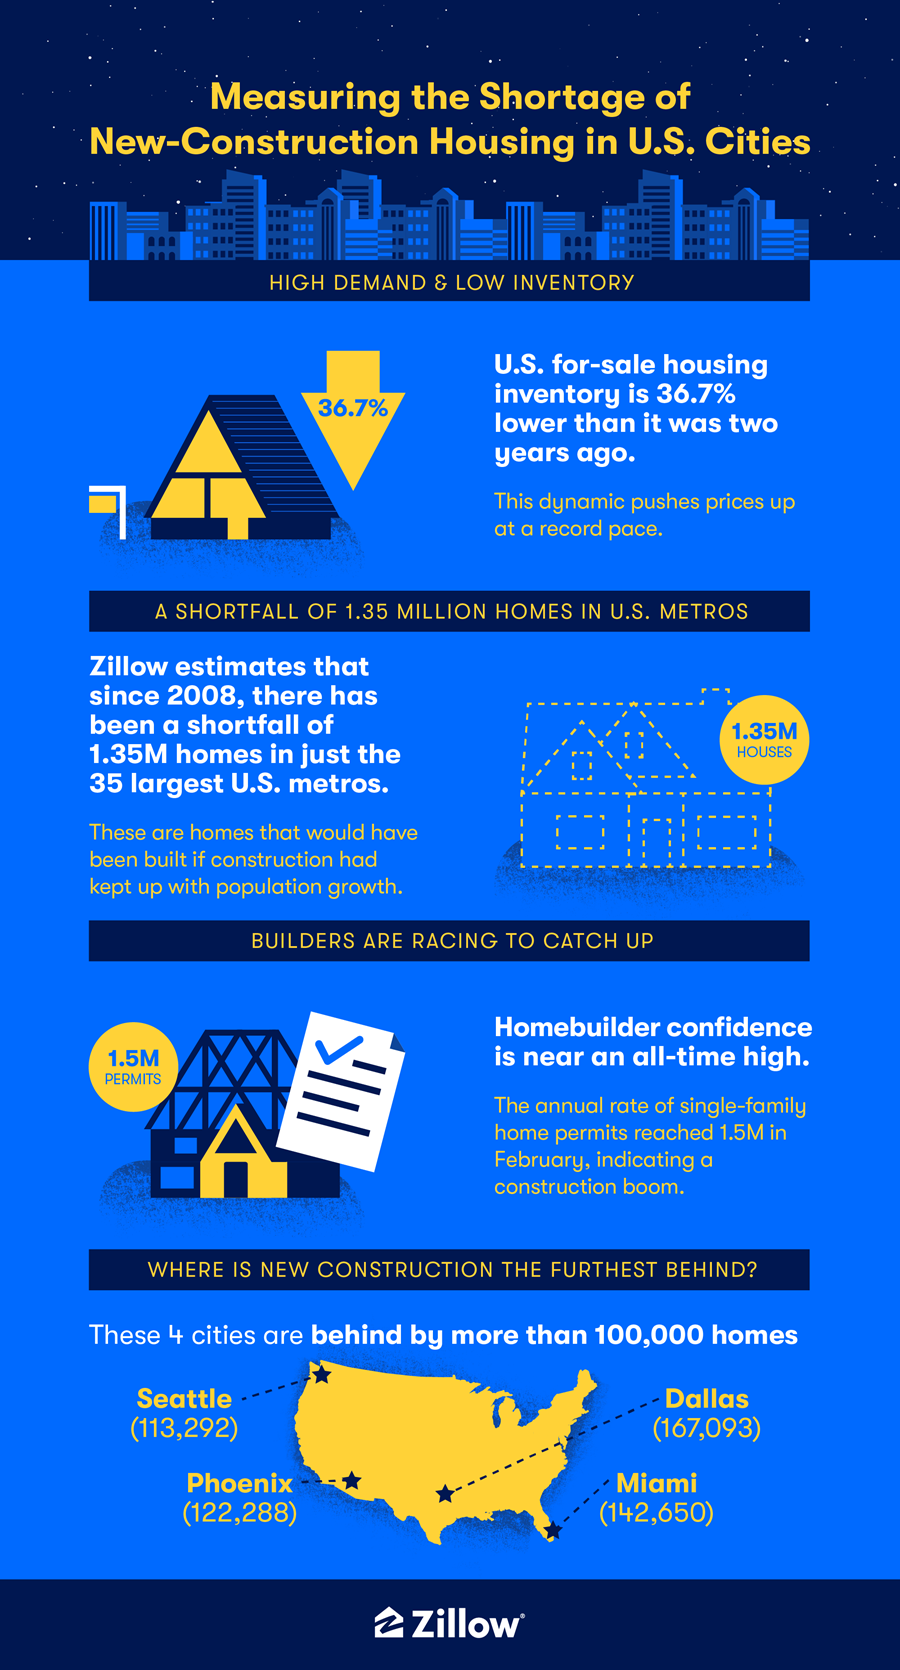
- There is a shortage of 1.35 million new construction homes since the Great Recession in the 35 largest U.S. housing markets. That is as if no new homes were built for 2.7 years.
- Builders are racing to catch up, but supply chain disruptions and labor shortages are slowing their efforts.
- The biggest new-construction shortfalls since 2008 have been in Dallas, Miami, Phoenix and Seattle. Chicago, Pittsburgh and Detroit have the biggest surpluses.
Dec 3, 2021
SEATTLE, Dec. 3, 2021 /PRNewswire/ -- We are officially in a house-permitting boom and home builder confidence is near an all-time high. A new Zillow® analysis shows how far builders still have to go to fill a 1.35 million new-home construction shortfall caused by a decade of underbuilding.

New-home construction in the U.S. reached an important benchmark in February, when more than 1.5 million residential building permits were issued over the prior 12 months. This level of activity indicates a housing boom that hasn't been seen since August 2007. The momentum continued through the summer, reaching 1.69 million permits in the year ending in August. This building boom has drawn comparisons to the glut that characterized the Great Recession, but in truth, builders are only beginning to fill the hole of unmet demand that was dug in the fallout from the mid-2000s housing bust.
"Builders in recent months have put the pedal to the metal to get new homes up and meet a rush of demand, and we just saw the first full year of above-average construction since the mid-2000s housing crash," says Zillow senior economist Jeff Tucker. "This isn't a new boom cycle of new construction so much as it's an attempt to get even from the last bust. There is still a long way to go to catch up from more than a decade of slow construction, and some markets have longer to go than others."
Comparing new construction to population growth, Zillow estimates that since 2008, there has been a shortfall of 1.35 million homes in just the 35 largest U.S. metros.i That is, there would have been 1.35 million more new single-family construction permits handed out if they had kept up with population growth at the same rate as they did between 1985 and 2000. At the current pace of permitting, that shortfall is as if no homes at all were built for 2.7 years.
Permits only tell half the story. Those homes still need to be built, but builder activity has been hobbled by supply chain disruptions and labor shortages. Despite builders' best efforts, the completion of new home builds has stalled after a blistering spring, and the latest reading shows an 8.4% dip since last year. The number of homes permitted, but not started, is up 44.8% from a year ago.ii
It's also not clear whether simply keeping up with the pace of prerecession construction is enough to meet current demand. The average household size is about as small as it has ever been -- there are about 2.5 people per household now, compared to three people per household as recently as the mid-1970s -- meaning more homes are needed as the population grows.iii There are also millions of "missing" households over the past 15 years: households headed by people who, historically, would be expected to have their own home by their current age but have been unable or unwilling to move out on their own. Those households need to be taken into account when considering how many homes to build.
The implications of this shortfall are being felt now as home prices surge across the country. The demographic makeup of the U.S. and the ability for many to work remotely have boosted housing demand. The shortage of homes in the most heavily populated markets have left home shoppers competing for a limited supply, pushing up prices. Since the Great Recession, single-family residences have appreciated much more than other types of homes, such as condos and co-ops, up 47.9% since January 2008, compared to 29.4%.
Dallas has had the biggest postrecession shortfall of single-family building permits, falling 167,093 homes behind the pre-2000 average. Miami (142,650), Phoenix (122,288) and Seattle (113,292) have also fallen behind by more than 100,000 homes.
Nine metros now have a surplus of new single-family construction by this measure, including Chicago, Pittsburgh and Detroit. These nine metros generally have seen modest population growth since 2008, and home value growth in all but Pittsburgh has lagged behind the national average during that time.
There is no one solution to the housing shortage, and any fix will play out over many years. A panel of experts surveyed by Zillow earlier this year stated that relaxing zoning rules would be the most effective way to increase supply. Previous Zillow research has shown that even allowing for modest densification across large metro areas could allow for enough new homes to slow the growth of home prices over the long term.
|
Metropolitan Area* |
New Construction |
Typical Home Value: |
Home Value Growth |
|
United States |
-1,350,459 |
$312,728 |
49.0% |
|
New York, NY |
31,634 |
$569,191 |
22.5% |
|
Los Angeles, CA |
-13,008 |
$851,308 |
49.4% |
|
Chicago, IL |
73,467 |
$286,280 |
6.0% |
|
Dallas–Fort Worth, TX |
-167,093 |
$332,118 |
107.0% |
|
Philadelphia, PA |
16,949 |
$309,597 |
23.4% |
|
Houston, TX |
-64,354 |
$272,066 |
71.6% |
|
Washington, D.C. |
-98,985 |
$520,598 |
23.0% |
|
Miami–Fort Lauderdale, FL |
-142,650 |
$381,256 |
28.8% |
|
Atlanta, GA |
-78,593 |
$322,123 |
61.1% |
|
Boston, MA |
-63,160 |
$605,224 |
56.5% |
|
San Francisco, CA |
-85,364 |
$1,346,995 |
86.8% |
|
Detroit, MI |
46,990 |
$225,066 |
41.6% |
|
Riverside, CA |
-73,265 |
$525,941 |
45.9% |
|
Phoenix, AZ |
-122,288 |
$418,170 |
58.7% |
|
Seattle, WA |
-113,292 |
$695,058 |
73.9% |
|
Minneapolis–St. Paul, MN |
-35,159 |
$349,595 |
40.4% |
|
San Diego, CA |
-64,625 |
$814,289 |
65.6% |
|
St. Louis, MO |
43,300 |
$220,861 |
29.5% |
|
Tampa, FL |
-56,654 |
$316,379 |
52.5% |
|
Baltimore, MD |
16,342 |
$349,655 |
6.2% |
|
Denver, CO |
-64,209 |
$574,734 |
122.8% |
|
Pittsburgh, PA |
47,254 |
$200,185 |
65.7% |
|
Portland, OR |
-39,986 |
$532,300 |
67.0% |
|
Charlotte, NC |
-23,756 |
$324,163 |
72.1% |
|
Sacramento, CA |
-30,331 |
$567,023 |
57.9% |
|
San Antonio, TX |
-83,824 |
$265,602 |
70.4% |
|
Orlando, FL |
-63,824 |
$328,555 |
28.6% |
|
Cincinnati, OH |
5,183 |
$236,963 |
48.6% |
|
Cleveland, OH |
35,210 |
$199,110 |
34.0% |
|
Kansas City, MO |
-9,665 |
$259,200 |
63.2% |
|
Las Vegas, NV |
-48,480 |
$385,325 |
26.6% |
|
Columbus, OH |
-36,233 |
$266,594 |
63.7% |
|
Indianapolis, IN |
-11,171 |
$235,663 |
68.7% |
|
San Jose, CA |
-25,756 |
$1,493,020 |
87.5% |
|
Austin, TX |
-51,065 |
$527,134 |
139.6% |
|
*Table ordered by market size |
About Zillow Group
Zillow Group, Inc. (NASDAQ: Z and ZG) is reimagining real estate to make it easier to unlock life's next chapter.
As the most visited real estate website in the United States, Zillow® and its affiliates offer customers an on-demand experience for selling, buying, renting or financing with transparency and nearly seamless end-to-end service. Zillow Home Loans™, our affiliate lender, provides our customers with an easy option to get pre-approved and secure financing for their next home purchase. In September 2020, Zillow launched Zillow Homes, Inc., a licensed brokerage entity, to streamline Zillow Offers transactions.
Zillow Group's affiliates and subsidiaries include Zillow®, Zillow Offers®, Zillow Premier Agent®, Zillow Home Loans™, Zillow Closing Services™, Zillow Homes Inc., Trulia®, Out East®, ShowingTime®, Bridge Interactive®, dotloop®, StreetEasy® and HotPads®. Zillow Home Loans LLC is an Equal Housing Lender, NMLS #10287 (www.nmlsconsumeraccess.org).
i Comparing the rate of permits per population growth in each of the 35 largest U.S. metro areas from 2008 to 2020 to the average U.S. rate from 1985 to 2000.
ii U.S. Census Bureau and U.S. Department of Housing and Urban Development, New Residential Construction, November 17, 2021.
iii U.S. Census Bureau, Historical Households Table 4: https://www.census.gov/data/tables/time-series/demo/families/households.html.
SOURCE Zillow

For further information: Alex Lacter, Zillow, press@zillow.com