
Press releases
Pace of Home Sales Trending Well Ahead of Last Year
This Zillow Weekly Market Report includes housing market data as of the week ending July 25
Jul 31, 2020
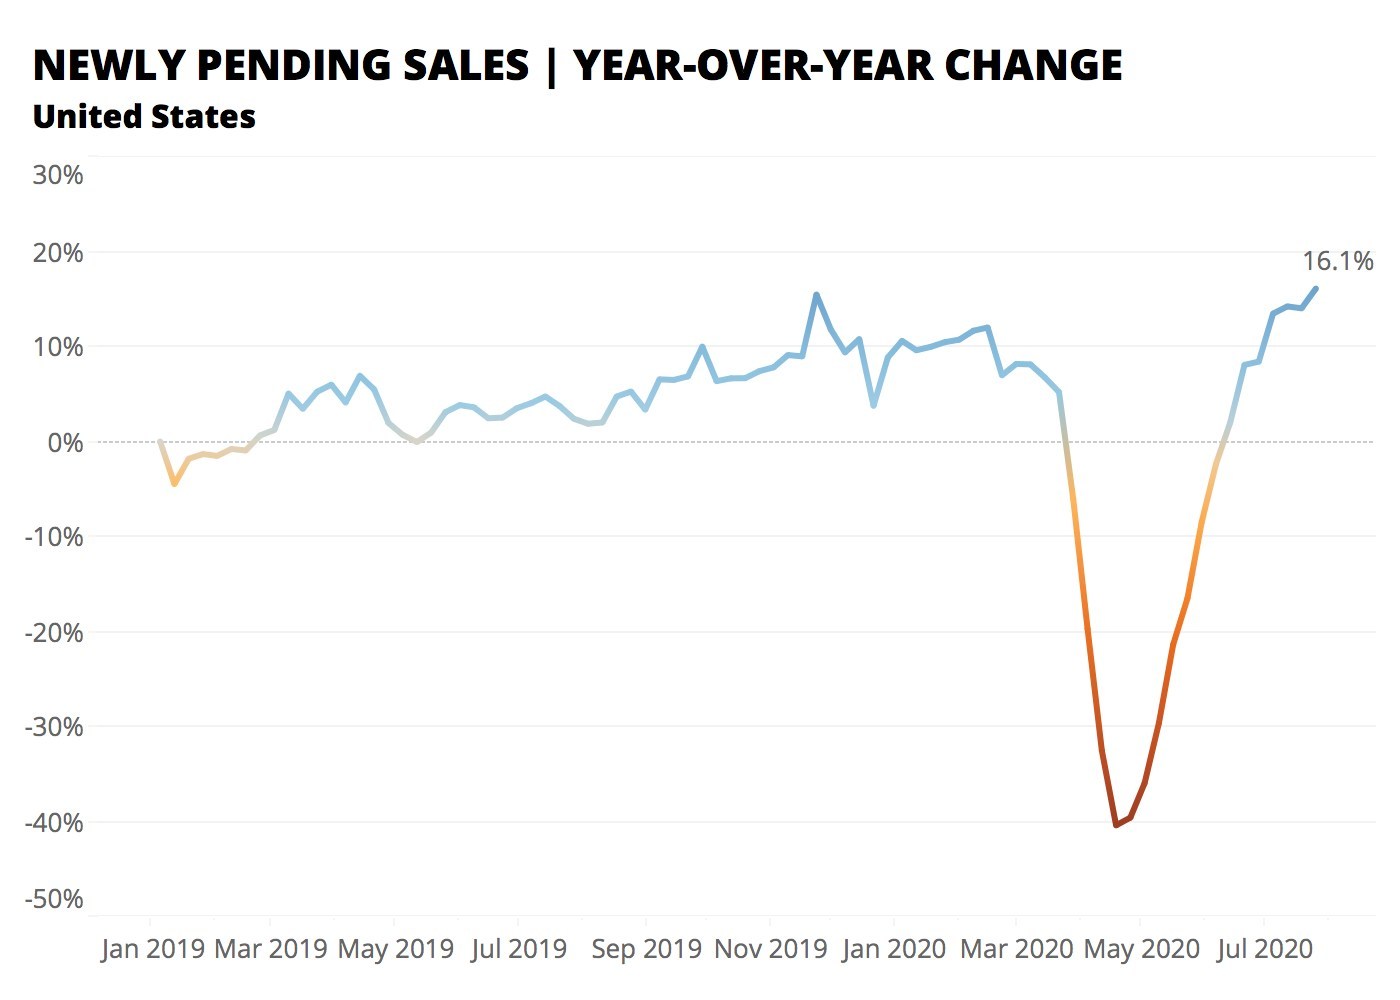
SEATTLE, July 31, 2020 /PRNewswire/ -- Homes shifting from for-sale to pending, a leading indicator of completed sales, are 16.1% higher than last year, Zillow's Weekly Market Reporti shows. New listings are not keeping pace with buyer demand, causing homes to typically sell after only two weeks on the market -- a record pace in Zillow data that dates back to the start of 2019.
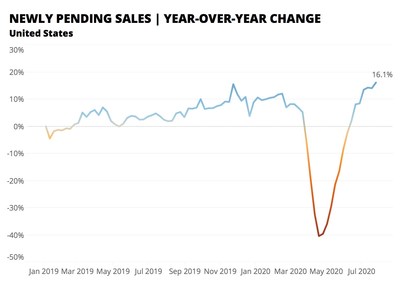
Newly pending sales are slowing as we enter the last summer month, but market pace remains well ahead of last year
- Newly pending sales are down 1.4% month over month due to seasonal trends, but are up 16.1% year over year and are continuing to post accelerating growthii.
- Homes that went under contract last week typically were plucked off the market after just 14 days, one day faster than the previous week and nine days faster than last year.
Sellers continue to remain largely on the sidelines
- New for-sale listings fell 2.2% from last week, and are now down 12.2% year over year.
- Total inventory continues to fall without an influx of new listings. Total inventory fell 0.9% from the previous week, and is now down 26.3% year over year.
Prices continue on steady climb
- List prices have been steadily rising throughout 2020, up 0.3% week over week to $342,660. That's 6% higher than a year ago.
- The median sale price the week ending June 13 was $263,819, 0.5% higher than the previous week and up 0.7% year over year.
- 4.2% of listings last week had cut their price, the same share as the week prior and 1.3 percentage points less than a year ago.
Metropolitan | Newly | Newly | Median | New | New | Total | Median | Median |
United States | 16.1% | -0.6% | 14 | -12.2% | -2.2% | -26.3% | $263,819 | 0.7% |
New York, NY | N/A | 3.5% | 28 | 12.7% | 1.3% | -20.6% | $427,040 | 4.1% |
Los Angeles- | 2.1% | 2.0% | 14 | -7.0% | -0.6% | -27.4% | $663,000 | 1.7% |
Chicago, IL | 37.0% | 0.6% | 14 | -3.5% | -2.7% | -24.8% | $249,600 | 0.0% |
Dallas-Fort | 22.3% | -3.2% | 24 | -19.8% | -5.1% | -23.0% | $284,150 | 0.8% |
Philadelphia, PA | N/A | -1.5% | 9 | 8.9% | 4.5% | -35.4% | $259,490 | 0.6% |
Houston, TX | N/A | -0.4% | 18 | -12.9% | -3.7% | -21.5% | $249,728 | 0.2% |
Washington, DC | N/A | 2.8% | 7 | 0.3% | 2.6% | -34.4% | $427,246 | 0.0% |
Miami-Fort | N/A | -0.7% | 31 | -4.5% | 2.3% | -10.8% | $316,550 | 8.9% |
Atlanta, GA | 13.7% | -4.0% | 16 | -21.1% | 0.1% | -17.2% | $263,453 | 0.4% |
Boston, MA | 17.5% | -0.7% | 8 | -13.8% | -13.8% | -24.2% | $495,390 | 3.6% |
San Francisco, | N/A | 5.0% | 12 | 15.7% | 1.9% | -8.7% | $851,000 | -1.6% |
Detroit, MI | N/A | -0.5% | 8 | -11.4% | -3.1% | -29.3% | $201,830 | -1.8% |
Riverside, CA | 13.7% | -0.6% | 12 | -9.9% | -3.0% | -42.1% | $386,184 | 2.8% |
Phoenix, AZ | N/A | -2.1% | 14 | 1.0% | -0.7% | -28.2% | $303,314 | 4.2% |
Seattle, WA | N/A | 3.5% | 6 | -10.4% | -3.8% | -37.5% | $512,247 | 0.6% |
Minneapolis- | N/A | -0.5% | 18 | -18.9% | -4.9% | -23.4% | $293,850 | 2.9% |
San Diego, CA | N/A | 4.1% | 8 | -7.4% | 1.7% | -37.4% | $598,650 | 2.4% |
St. Louis, MO | 13.5% | 0.8% | 7 | -10.7% | 1.4% | -29.0% | $203,980 | 2.4% |
Tampa, FL | N/A | N/A | 11 | -8.8% | 2.7% | -29.6% | $243,576 | 6.3% |
Baltimore, MD | 12.6% | -0.7% | 11 | -15.0% | -1.0% | -42.0% | $301,100 | -0.7% |
Denver, CO | 18.9% | -0.6% | 7 | 1.2% | -6.8% | -26.3% | $435,872 | 0.7% |
Pittsburgh, PA | N/A | -1.2% | 8 | -13.6% | -12.0% | -25.2% | $180,080 | -2.4% |
Portland, OR | 15.3% | 1.9% | 6 | -6.3% | 4.9% | -29.7% | $416,198 | 1.6% |
Charlotte, NC | -8.2% | -2.0% | 7 | -26.7% | -0.8% | -37.2% | $263,039 | -2.3% |
Sacramento, | 16.8% | -2.5% | 9 | -3.8% | -4.4% | -33.4% | $435,400 | 2.3% |
San Antonio, | N/A | -0.8% | 26 | -25.1% | -5.9% | -19.8% | $244,860 | 3.0% |
Orlando, FL | N/A | N/A | 12 | -10.2% | 0.4% | -15.5% | $268,580 | 3.4% |
Cincinnati, OH | 4.4% | -2.0% | 4 | -25.8% | -3.9% | -35.5% | $202,640 | 6.4% |
Cleveland, OH | 24.1% | 0.9% | 15 | -13.7% | -0.5% | -36.7% | $166,430 | 2.0% |
Kansas City, | N/A | -3.2% | 5 | -20.5% | -8.3% | -37.8% | $242,932 | 2.7% |
Las Vegas, NV | N/A | -1.4% | 20 | -3.6% | 0.9% | -26.9% | $302,349 | 2.4% |
Columbus, | 4.1% | -1.2% | 4 | -27.2% | -0.5% | -33.9% | $223,120 | 2.2% |
Indianapolis, | N/A | -1.1% | 4 | -14.6% | -1.3% | -35.8% | $212,700 | 7.6% |
San Jose, CA | N/A | -3.4% | 16 | 22.0% | -13.0% | -25.9% | $1,116,580 | 1.2% |
Austin, TX | N/A | -1.8% | 8 | -22.3% | -6.1% | -25.6% | $337,545 | 1.8% |
Virginia | N/A | 5.1% | 37 | 0.6% | -0.5% | -35.0% | $265,095 | 1.0% |
Nashville, TN | N/A | N/A | 34 | -28.4% | -0.3% | -12.4% | $305,995 | 1.8% |
Providence, | N/A | -0.3% | 12 | -0.9% | -4.8% | -32.4% | $304,400 | 2.9% |
Milwaukee, | N/A | N/A | 28 | 2.8% | 10.5% | -11.3% | $245,860 | 3.0% |
Jacksonville, | 24.2% | 1.3% | 16 | -3.9% | 0.3% | -27.9% | $254,209 | 1.7% |
Memphis, TN | N/A | 1.1% | 6 | -22.6% | -6.9% | -36.5% | $199,480 | 1.8% |
Oklahoma | N/A | 0.7% | 9 | -14.1% | -3.9% | -27.0% | $196,994 | 2.8% |
Louisville, KY | N/A | 0.7% | 6 | -22.6% | -6.9% | -37.7% | $203,660 | 1.9% |
Hartford, CT | 40.3% | 1.6% | 9 | -10.8% | -13.2% | -39.6% | $236,650 | 0.2% |
Richmond, VA | N/A | N/A | 6 | -25.3% | -8.1% | -30.2% | $273,500 | 3.8% |
New Orleans, | 32.9% | 0.2% | 17 | -13.3% | -4.6% | -34.6% | $223,154 | 5.4% |
Buffalo, NY | 12.2% | 0.4% | 9 | 13.0% | 4.1% | -29.3% | $174,299 | 4.1% |
Raleigh, NC | N/A | -2.6% | 5 | -9.9% | -8.1% | -31.7% | $298,350 | 0.5% |
Birmingham, | 30.8% | -1.2% | 8 | -15.2% | -9.4% | -30.8% | $220,362 | 0.4% |
Salt Lake City, | N/A | N/A | 7 | -20.0% | 7.5% | -36.9% | $357,930 | 4.5% |
*Table ordered by market size | ||||||||
**As of the week ending June 13 | ||||||||
About Zillow
Zillow, the top real estate website in the U.S., is building an on-demand real estate experience. Whether selling, buying, renting or financing, customers can turn to Zillow's businesses to find and get into their next home with speed, certainty and ease.
In addition to for-sale and rental listings, Zillow Offers buys and sells homes directly in dozens of markets across the country, allowing sellers control over their timeline. Zillow Home Loans, our affiliate lender, provides our customers with an easy option to get pre-approved and secure financing for their next home purchase.
Millions of people visit Zillow Group sites every month to start their home search, and now they can rely on Zillow to help them finish it — with the same confidence, ease and empowerment they've come to expect from real estate's most trusted brand.
Zillow is owned and operated by Zillow Group, Inc. (NASDAQ: Z and ZG).
i The Zillow Weekly Market Reports are a weekly overview of the national and local real estate markets. The reports are compiled by Zillow Economic Research and data is aggregated from public sources and listing data on Zillow.com. New for-sale listings data reflect daily counts using a smoothed, seven-day trailing average. Total for-sale listings, newly pending sales, days to pending and median list price data reflect weekly counts using a smoothed, four-week trailing average. For more information, visit www.zillow.com/research/.
ii National newly pending sales trends are based upon aggregation of the 38 largest metro areas where historic pending listing data coverage is most statistically reliable, and excludes some metros due to upstream data coverage issues.
SOURCE Zillow

For further information: Alex Lacter, Zillow, press@zillow.com